useR! poster: ranking influential communities
Next week I will be presenting a poster at the useR!2017 conference in Brussels.
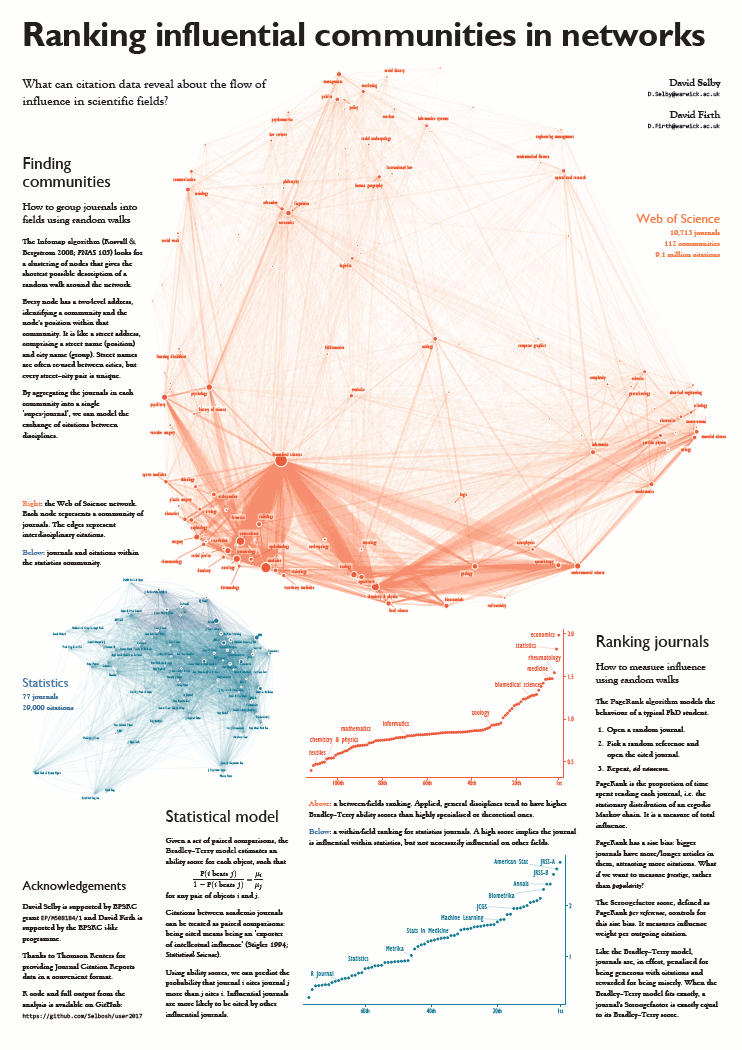
My topic is Ranking influential communities in networks. Using a large dataset of citations from the Web of Science, we grouped academic journals into communities based on their citation behaviour. These communities closely correspond to recognisable research fields, so I was able to label them.
We then modelled the flow of influence within and between these communities. A journal having a high influence score means it tends to receive more citations than it gives out when interacting with other influential journals.
Statistics comes second in the inter-field ranking (after economics). We all know how cool statistics is, so the model must be right.

Here is a preview. You can download the full PDF on the conference web site.
The poster is mostly reproducible: the full R source code for the analysis is available on GitHub, as is the Scribus file that generated the poster itself. I say ‘mostly’ because the code is open but unfortunately the raw data is not.
In a maximally reproducible workflow, we could even consider designing the entire poster with Markdown. An idea for a future R package, perhaps?
