Cloudy with a chance of engagement
Last summer I took part in an internship with the fledgling Alan Turing Institute at the British Library in London. My group helped analyse data from Cloudy with a Chance of Pain, a citizen science project that uses smartphone app data to model the relationship between weather and joint pain.
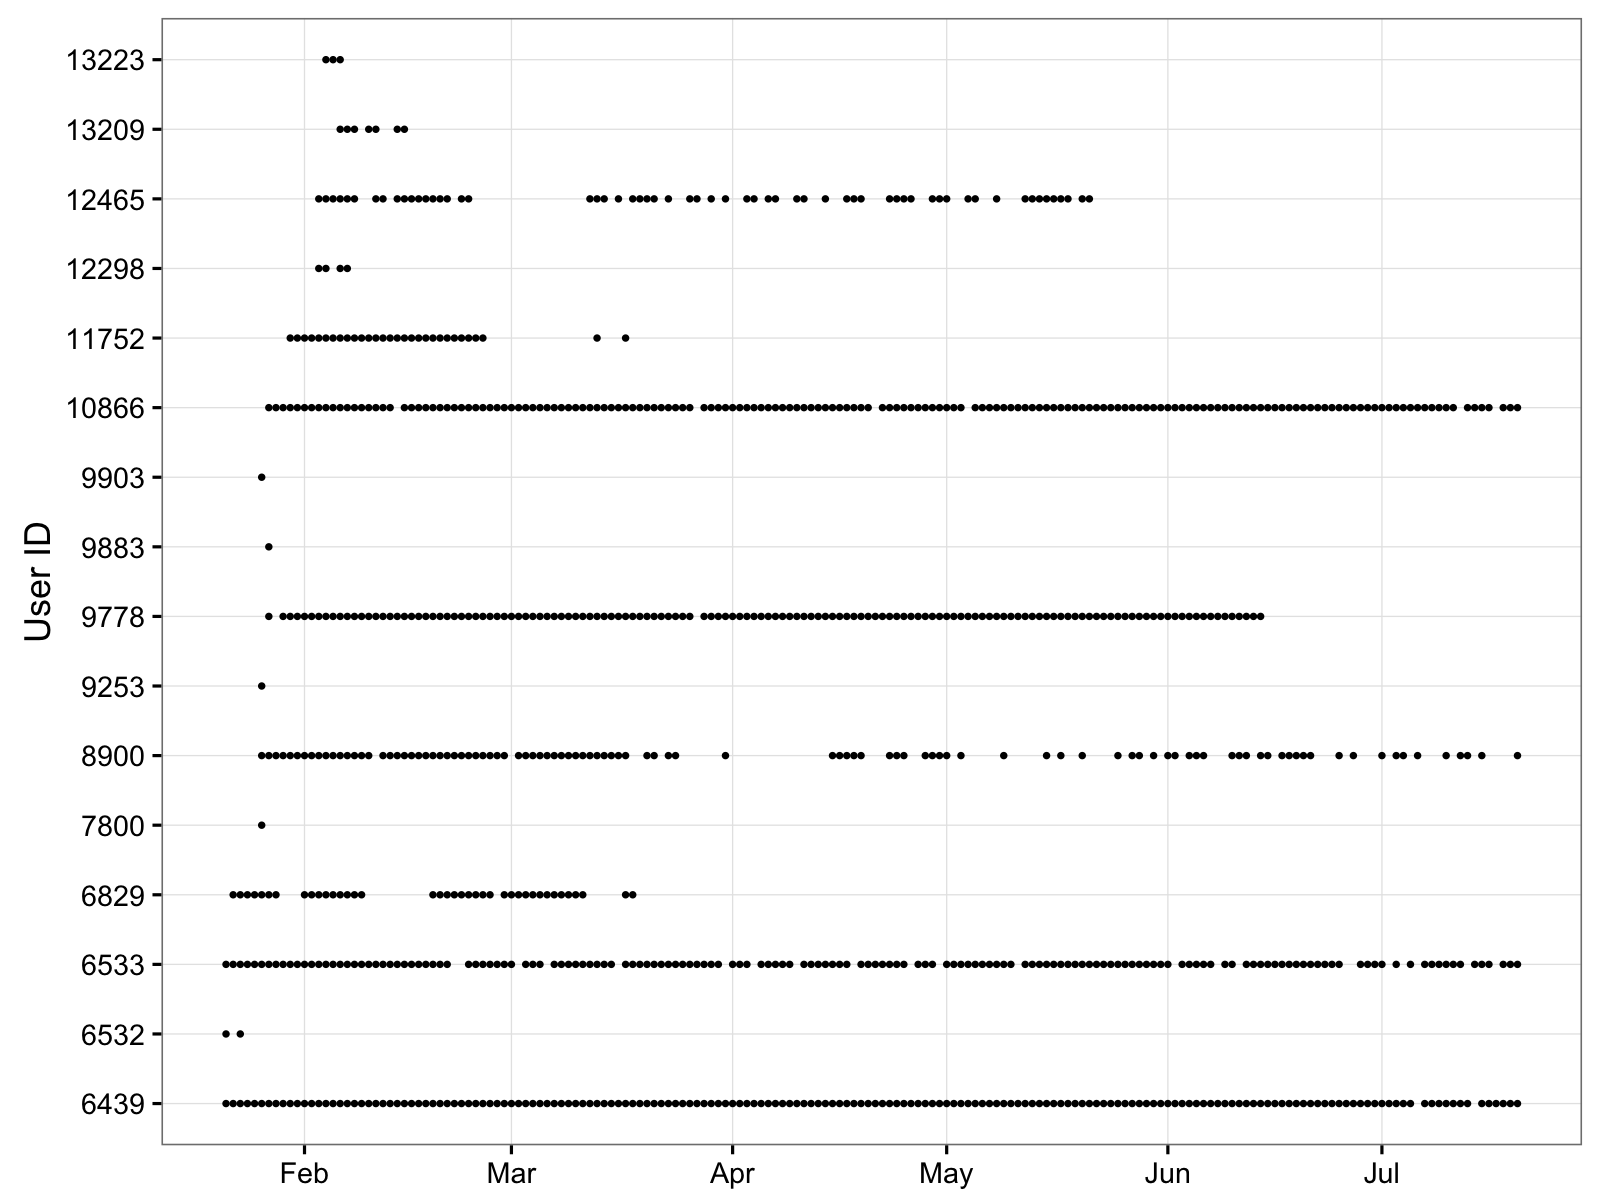
A robust statistical model relies on a steady stream of self-reported pain data from each participant. Naturally, the actual data available was nothing like that. It looked more like this:

Unlike in a traditional epidemiological study, people could join at any time. Some reported data every day, some every couple of days, some had one week on, one week off, while others would lose interest after a few months, after a few weeks or even after the first day.
To avoid selection bias in a subsequent analysis, we needed to understand the behaviour of these participants. Why do some people drop out? Why do some people give more data than others?
Some accepted measures of ‘engagement’ in longitudinal studies might include counting people who provided data after a particular date, or the proportion of people who used the app on more than x% of days. These thresholds are often arbitrary and can quickly lead us down a garden of forking paths, where we (consciously or subconsciously) choose values that return the result we want.
Instead, we went for a more automated approach that clustered user data using a mixture of hidden Markov models. At any time, an app user could be in one of three states: high engagement, low engagement or disengagement. Each user is clustered according to their probability of switching between these states, allowing us to compare and contrast highly-engaged users with ‘tourists’.
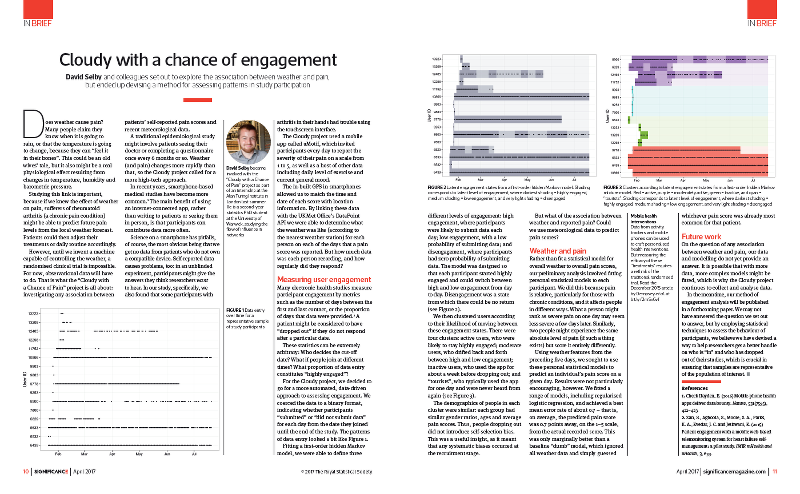
An article I wrote about this project was recently published in Significance, the magazine of the Royal Statistical Society and American Statistical Association. For more details on what we did, read the article.

